
Read your stats
Stats turns your days into numbers and charts. Look at everything at once, or pick one tracker and a week, month or year.
Updated

General and for each tracker
Stats opens on General: Days tracked, Active trackers, Days with any data and your Most logged tracker. With Loggr Pro the Insights card is on top.
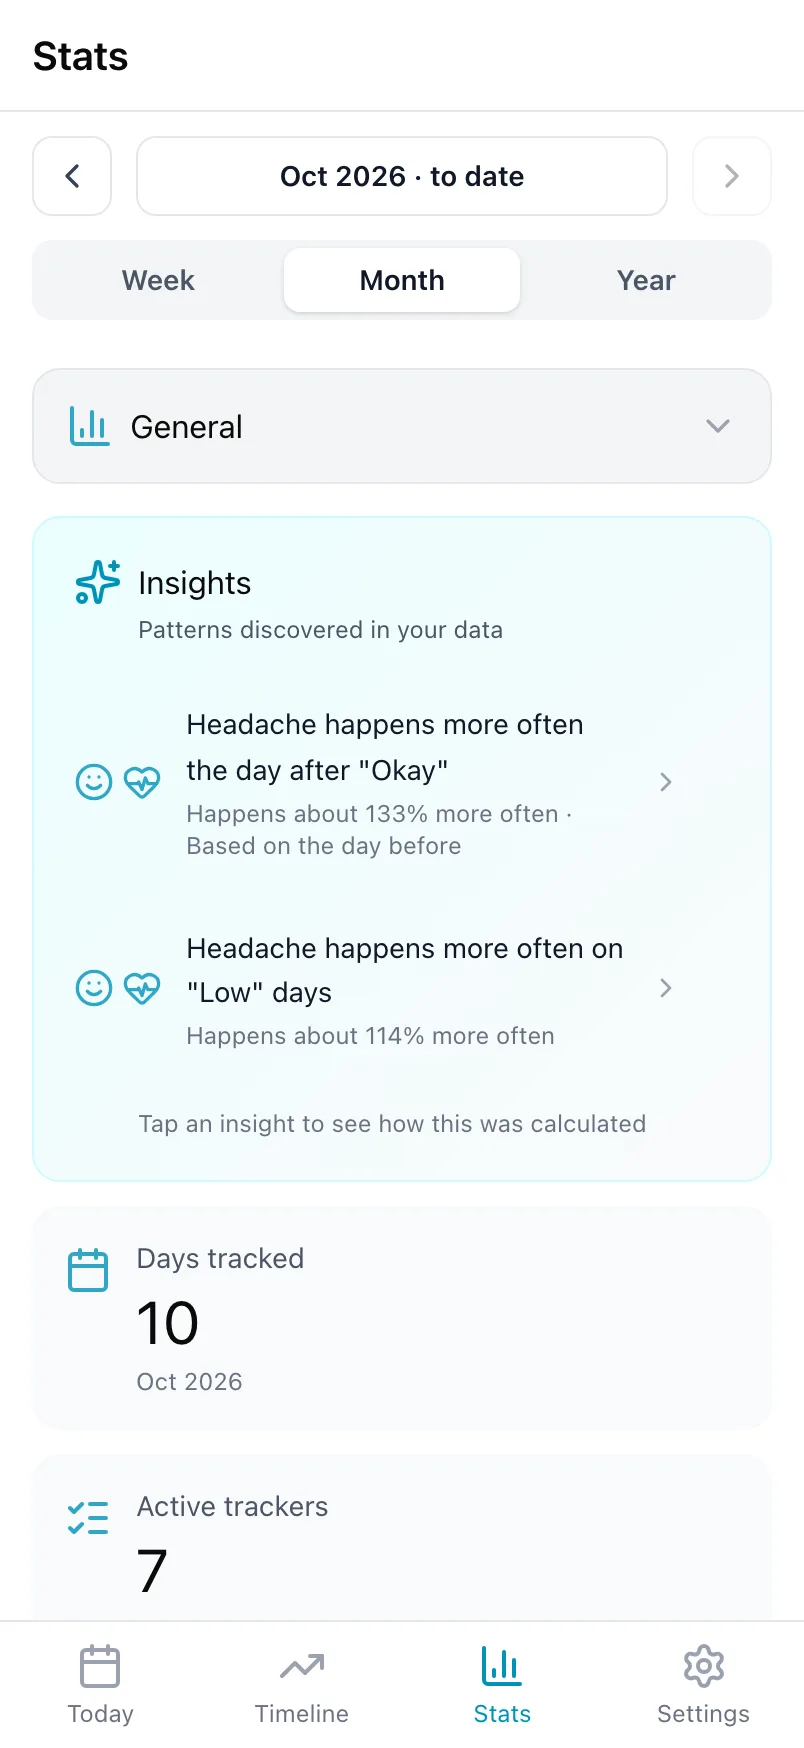
Tap General at the top to choose one tracker. What you then see depends on its kind:
| Kind | What Stats shows |
|---|---|
| Number | Average on logged days, average per calendar day, total, days with and without a value, trend chart |
| Scale | Averages, lowest and highest value, chart |
| Yes/No | Days with yes and with no, longest runs of yes and no |
| Choice list | Distribution, most common choice, trend |
| Text | Most frequent values, variety, usage over time |
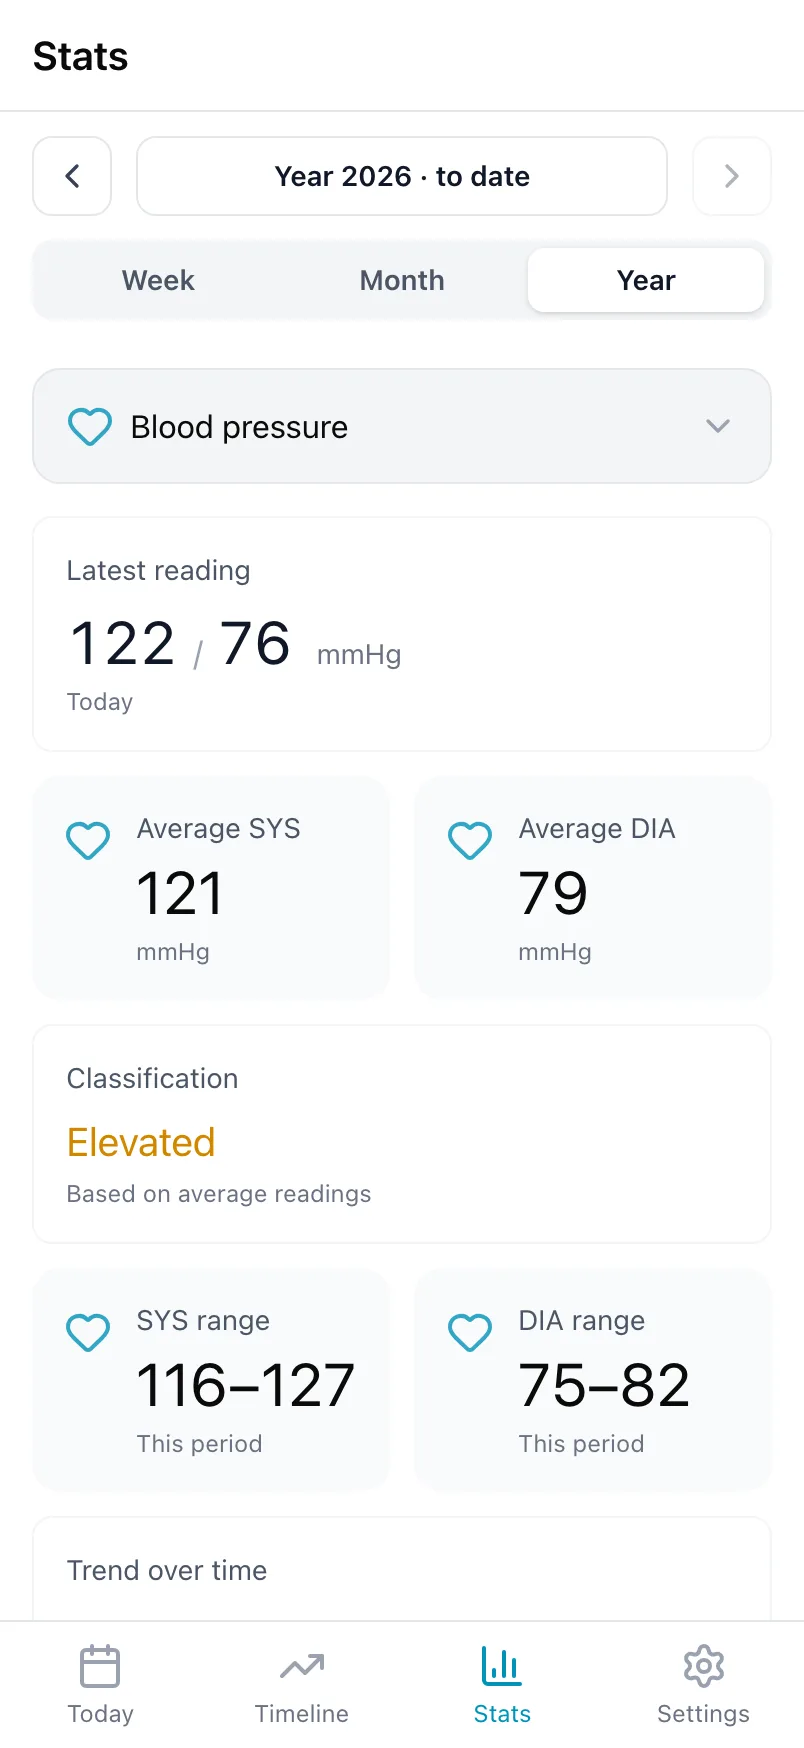
| Blood pressure | Latest reading, average SYS and DIA, classification, ranges |
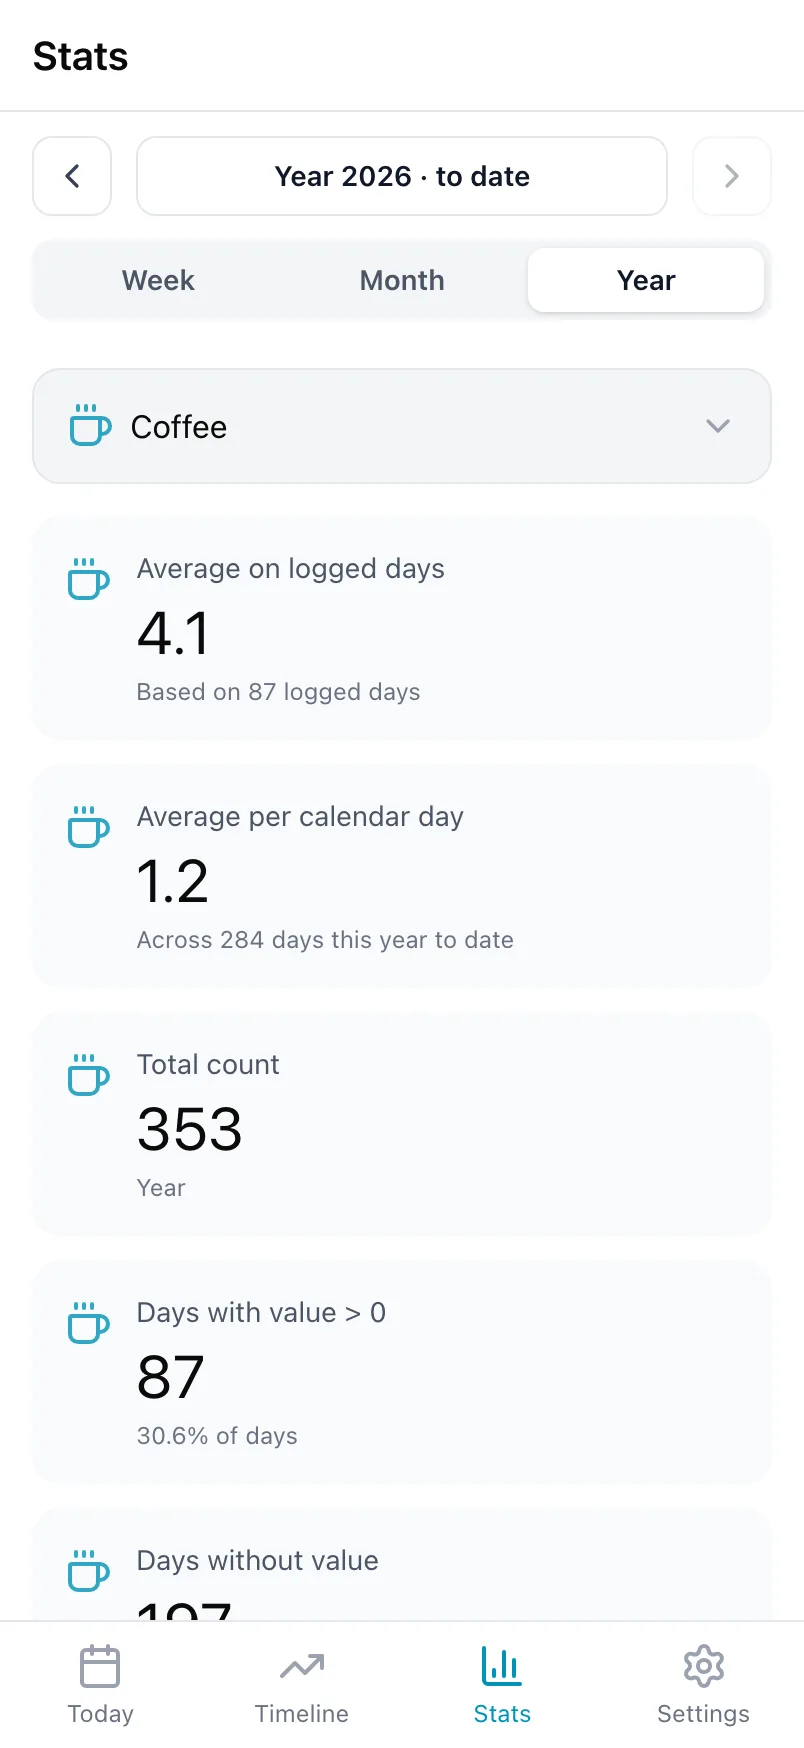
Choose the period
Under the period at the top, choose Week, Month or Year. The arrows go to the previous or next period. Tap the period itself to pick one from a list. The current period is marked "to date", because it is not over yet.
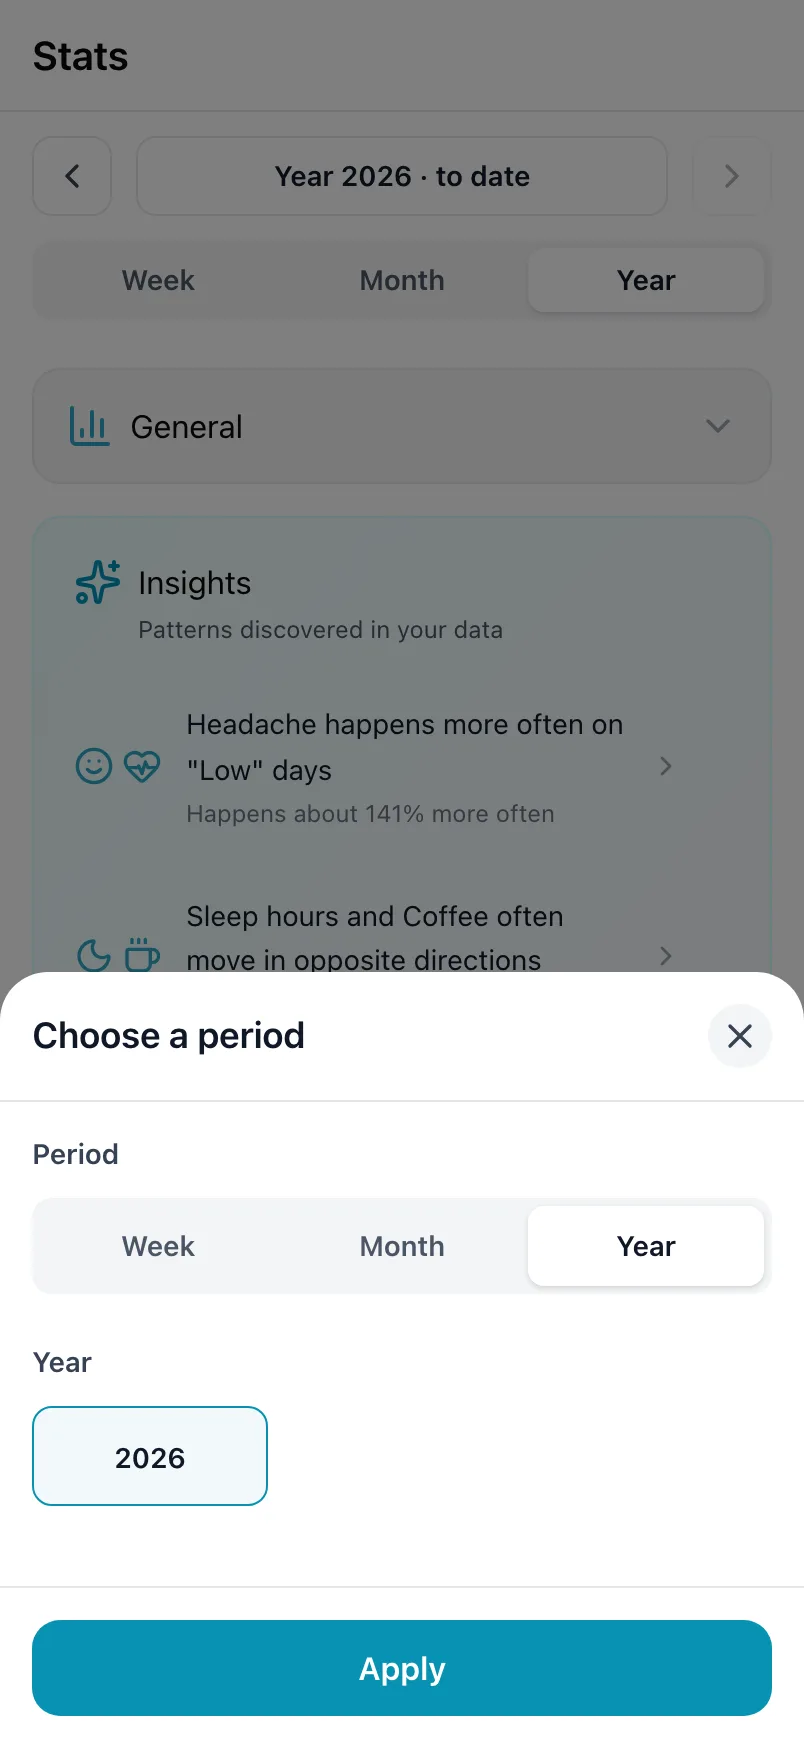
Weeks run from Monday to Sunday. Loggr only offers periods in which you logged something.
Two averages for a number
A Number has two averages. Average on logged days only counts the days you logged something. Average per calendar day spreads the total over every day of the period.
Logged 3 cups of coffee on 2 days of a week? The first average is 3, the second is 6 divided by 7, so a little under 1.
Days you did not log can also count as 0, when Auto-fill missing days is on for it.
Blood pressure
For blood pressure Stats shows your latest reading, your average top and bottom number and how your readings classify, from Low and Normal to High. That classification follows the common blood pressure categories and is not a diagnosis; talk to your doctor about your readings.
Frequently asked questions
What can I see in Stats?
Stats opens on General, with Days tracked and your Most logged tracker. Choose a tracker at the top to see its own numbers, which depend on the kind: averages and a trend chart for Number and Scale, days with yes and runs of yes for Yes/No, a distribution for Choice list, the most frequent values for Text and a classification for blood pressure.
Choose Week, Month or Year to change the period. Only periods in which you logged something are offered.
Why does a Number have two averages?
Average on logged days only counts the days you logged something for it. Average per calendar day spreads the total over every day of the period, also the days you logged nothing.
If you logged 3 cups of coffee on 2 days of a week, the first average is 3 and the second is 6 divided by 7.
What does Auto-fill missing days do?
Number and Scale have the option Auto-fill missing days, which is on by default. On a day where you logged other things but not this one, Loggr counts it as 0 for a number, or as the lowest value for a scale.
Keep it on for daily counters such as coffee or water, where not logging means none. Switch it off under Edit tracker for things you log now and then, such as a workout. Days without a value are then left out of its stats.