
July 2, 2026
Correlation vs Causation in Personal Data: How to Read Your Own Numbers Honestly
Personal analytics produces correlations all the time. The trap is treating each one as a cause. Here is what your own data can and cannot tell you, and how to act on a pattern without overclaiming.
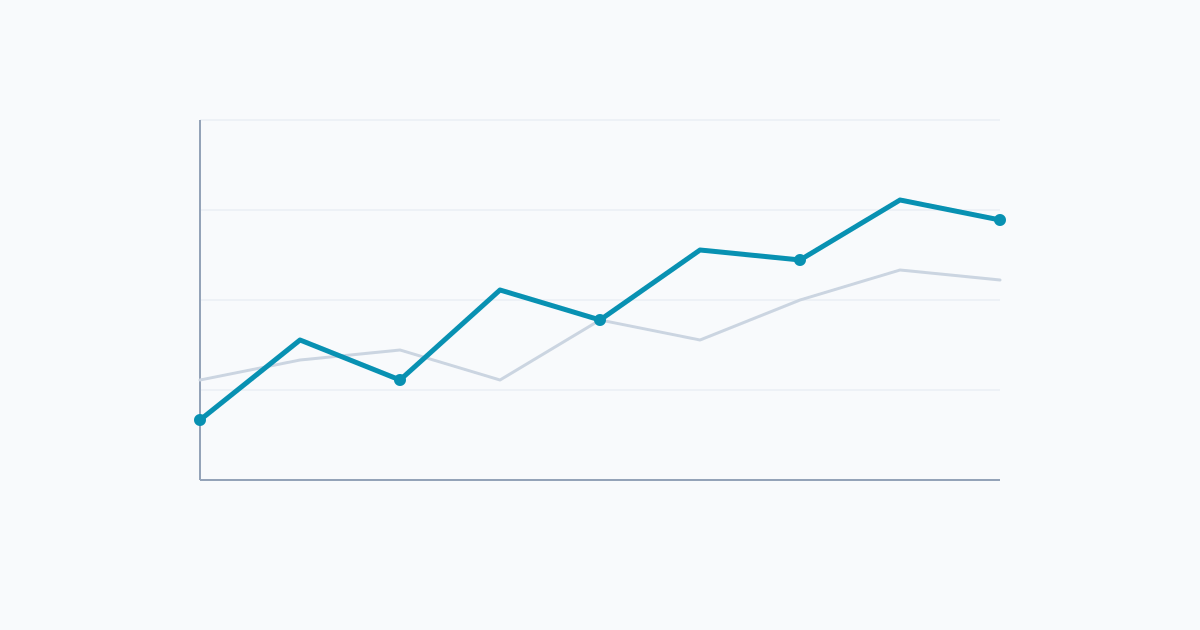
Here is a sentence that sounds true. “Days I drank more water are days I felt more focused. So water improves my focus.” The first half is fine. The second half is a leap, and that leap is where most personal analytics quietly goes wrong.
This article is about that leap. What a correlation in your own data tells you, what it does not, the four most common misreadings, and how to act on a pattern without overclaiming. If you are new to all this, start with our piece on personal analytics, then come back when you have a few weeks of logs.
What a correlation actually is
A correlation, in the personal sense, is a small statistical observation. It says: in your data, in this period, two fields tended to move together. When one was high, the other was high. Or when one was high, the other was low. Across many days, high water days lined up with high focus days more often than not.
That is a real fact about your logs. It is also a much narrower fact than it tends to feel.
A correlation is bounded in three ways at once. It is bounded to you, not anyone else. It is bounded to this period of your life, not the rest of it. And it is bounded by everything else that was happening on those days, which the correlation absorbs silently into its own shape. The number you see is the pattern after life squeezed through it, not before.
Reading a correlation as if it were a clean physical law is the easiest mistake to make, and most tracker apps do nothing to discourage it.
What a correlation is not
Four things in particular. None of these are picky semantic points. They are the difference between using your data well and fooling yourself with it.
It is not proof one thing caused the other
When water and focus move together, several stories fit equally well. Maybe water helps focus. Maybe focus, or whatever makes a focused day, also makes you drink more water (you remembered the bottle because the day was calm). Maybe both are downstream of something else, like a low-stress schedule, a weekend, a season. The correlation cannot tell these apart. Only an experiment can start to.
It is not proof the pattern will hold next month
A pattern that was clean in March can disappear in April. Your life changes, your habits change, the seasons change. A correlation describes what happened, not what will. Treating it as a forecast is overreading.
It is not proof the pattern generalises to anyone else
Your roommate could log the exact same fields for the same weeks and get a different shape. Personal analytics is, by design, personal. A pattern in your own data has no claim on anyone else, and theirs has no claim on you.
It is not actionable on its own
This is the one most people miss. Even a strong correlation does not, by itself, tell you whether changing one field will change the other. Because the cause might run the other direction, or through a third factor, “do more of X to get more of Y” is a hypothesis, not a conclusion. The honest move with a strong correlation is “let me test this,” not “let me act on this.”
The four most common misreadings
If you log carefully for a few months, you will run into all four of these. Naming them helps.
Confusing the direction
Water and focus is the classic example. Did the water help the focus, or did the kind of day where you can focus also happen to be the kind of day where you drank water? You feel the answer is the first one. The data is silent on which.
A direction-confused reading turns “X correlates with Y” into “X causes Y” by reflex, when “Y causes X” or “they share a cause” both fit the same numbers.
Confounders (the third variable)
Both fields might be moving together because something else is moving them both. Sleep. Stress. Weekend versus weekday. A deadline. A holiday. The weather. Your data sees the two fields, not the hidden third, and the hidden third quietly inflates the apparent link.
A useful exercise: when you see a strong correlation, write down three other things that were also happening on the high-X days. If most of those things ride along with X, the X-to-Y story is probably borrowing strength from them.
Reverse causation
“More water leads to more focus” can flip without breaking the data. “More tired leads to less water-drinking because tired you forgets the bottle” produces the same scatter of points. You cannot tell which is true from a correlation. You can guess from self-knowledge, but be honest that you are reasoning, not measuring.
Coincidence
The quietest and most common. With a small set of days, a fairly clean pattern can show up just because that is what small samples sometimes do. Two weeks of “every time I exercised I felt better” can flatten out by week six. The shorter the window, the more room there is for noise to look like a story.
The cure is more data. Patterns that survive a month or two of honest logging deserve more weight than patterns that show up in twelve days.
How to read a Loggr-surfaced correlation honestly
When Loggr surfaces a pattern, it does so in plain language with a small chart. Something like “on exercise days your mood score was meaningfully higher than on non-exercise days.” Loggr does not claim a cause, does not tell you what to do, and labels the strength so you can calibrate.
That is the input. Here is a checklist for what to do with it before you internalise anything.
Ask what else those days had in common
The exercise days are probably not just exercise days. They might also be the days you slept well, the days with calmer schedules, the days you were already feeling all right enough to want to move your body. The pattern Loggr surfaced is the outline of the relationship. The interior is up to you.
A simple test: pull up your daily notes from the high days and the low days side by side. Read them. Often the story shifts.
Ask how much data is behind it
Strong with a month or two of consistent logs is more credible than strong with two weeks. Loggr will not surface a pattern until there are enough paired days to justify it, but the threshold for “enough” is the minimum for a credible look, not for a settled conclusion. A pattern that has held across a season is meaningfully different from one that just crossed the line.
Ask how big the gap actually is
If on workout days your mood averaged 7.0 and on non-workout days 6.8, that is barely a story. If workout days were 7.0 and non-workout days were 5.0, that is a story. Loggr shows the comparison so you can see the gap; do not stop at “Loggr called it strong” and skip the part where you look at the numbers.
Ask whether you already wanted this to be true
The hardest one. If a pattern matches a belief you walked in with, treat it with more scepticism, not less. Confirmation bias is the strongest force in personal analytics, by a margin most users underestimate. A pattern that surprises you is more informative than one that confirms you, because your beliefs were already pulling the data.
What you can do with a correlation
The point of all this is not to make you stop looking at your data. It is the opposite. Correlations in personal data are useful when you treat them as the right kind of object: a hypothesis generator, not a conclusion. Three productive uses.
Generate a small experiment
Once you spot “exercise days correlate with better mood,” the productive next step is a small experiment. Deliberately exercise on a set of days you might not otherwise have, hold everything else as constant as life allows, and see what happens. Even an informal version of this is more honest than acting on the correlation as if it were proof. The experiment is the point.
This is also why same-day and day-after patterns belong in your toolkit. We wrote about day-after effects separately: the gap between cause and effect is part of what an experiment has to choose.
Notice what you were not paying attention to
A pattern is sometimes more useful for what it implies than for itself. “Exercise correlates with mood” might be telling you something about exercise. Or it might be telling you that the days you do not exercise tend to be Sundays, and that something about your Sundays is the actual story. The correlation pointed at exercise; what you noticed was something else. That counts.
Build self-knowledge over time
Knowing that three things tend to co-occur in your life is useful even without a causal account. You know the shape of your own week. You know which Mondays tend to be harder. None of this requires a proven cause. It only requires honest description, repeated long enough that the description becomes stable.
How Loggr is built around this honestly
The framing shows up in the product.
- Loggr surfaces patterns in plain language. No jargon-laden score, no claim of causation, no advice. The sentence describes what happened, not what to do.
- Loggr labels the strength: weak, moderate, or strong. A weak pattern is shown for what it is, not dressed up.
- Loggr will not surface a pattern until there are enough paired days behind it. Below that threshold, the insight is shown as locked, with a brief note on what is needed.
- Loggr compares fields same-day and with a one-day shift, then keeps whichever relationship is stronger. That is the day-after machinery from the pair-tracking guide. It cuts in both directions: a same-day pattern can hide a day-after pattern, and vice versa.
- Loggr does not interpret the pattern for you. The interpretation is the thinking, and the thinking is what makes the whole exercise worthwhile.
The hard discipline
If you take one habit from this article, take this one. When a correlation seems to confirm something you already believed, be more sceptical, not less.
The reason is structural. Your beliefs about your own life shaped how you logged in the first place: which fields you chose, how you rated your own mood, what you remembered. A pattern that confirms those beliefs is partly a reflection of those choices, not an independent fact. A pattern that contradicts your beliefs had to fight its way through your bias to show up. It earned the attention.
When a strong correlation lands on something you already knew, slow down. Run through the four misreadings above. Ask the four checklist questions. Then decide if you want to test it. Most of the time, the pattern survives and you have learned something honest. Sometimes it does not, and you have learned something even more honest: that you were reading your data through a lens.
FAQ
If I cannot prove causation, what is the point?
The point is sharper attention. Personal data does not replace thinking. It points your thinking at the right places. A correlation says “this might be worth looking at.” That is useful, as long as you do not promote it to “this is the answer.”
Can I do A/B tests on myself?
Formally, yes. Vary one input, hold the others as constant as life allows, log for a couple of weeks, then flip the input and log for a couple more. Compare. You will get something closer to a causal read than passive correlation can give you. Two caveats. You are still one person, so the result is about you in this period and nothing more. And life rarely lets you hold everything else constant. Personal A/B tests are useful and limited; both halves of that are true.
Should I act on a strong correlation?
Maybe, as an experiment. Not as a conclusion. The honest framing is: “I am going to try this for two weeks and see what happens, and I will not be surprised if it does not pan out.”
What if the correlation contradicts something I believed?
Pay more attention to it, not less. Patterns that survive contrary beliefs are usually more honest than patterns that confirm. A contrarian pattern got there despite the pull of your beliefs. That is harder evidence, by personal-analytics standards.
How long before I should trust a pattern?
A useful rule of thumb: a week is for setup, a month is for the first credible look, a season is for serious weight. Patterns that hold across a quarter, through different moods and weeks, are sturdier than patterns that show up in a single intense fortnight.
What if Loggr shows me two patterns that contradict each other?
This happens. Two fields can correlate with a third in opposite directions. Or a same-day pattern can run one way while a day-after pattern runs the other. That is the data being honest about itself. The right read is usually “there is a more complicated story here,” not “one of these is wrong.”
Key takeaways
- A correlation in your own data is a description of what happened in this period, in your life, with everything else absorbed into it. It is real. It is also narrower than it looks.
- A correlation is not proof of causation, not a forecast, not a generalisation to other people, and not actionable on its own.
- The four common misreadings are: confused direction, hidden third variables, reverse causation, and small-sample coincidence. All four are easy to fall into. None of them are catastrophic if you stay honest.
- Read a Loggr-surfaced pattern with four questions: what else did those days share, how much data is behind it, how big is the gap, and did I already want this to be true?
- The productive use of a correlation is to generate a small experiment, to notice what you were not paying attention to, and to build self-knowledge over time. None of these requires a causal claim.
- When a pattern confirms something you already believed, be more sceptical, not less. Confirmation bias is the strongest force in personal analytics.
Try this next time Loggr surfaces a pattern
The next time Loggr surfaces a correlation in your data, do not act on it yet. Write down three other things that might explain it, then decide whether one of them is more plausible than the story you reached for first. The exercise is the point. If you have not started logging yet, you can open Loggr and create your first field in a minute. Six field types, on iOS, Android, and web. The patterns will show up when there is enough to support them, in plain language, with a small chart. Reading them honestly is the part worth doing.