
June 4, 2026
Day-After Effects: Why Some Patterns in Your Data Only Show Up Tomorrow
Some of the strongest patterns in your own data are not between things measured the same day. They are between yesterday and today. Here is why most trackers miss them, and how to see them.
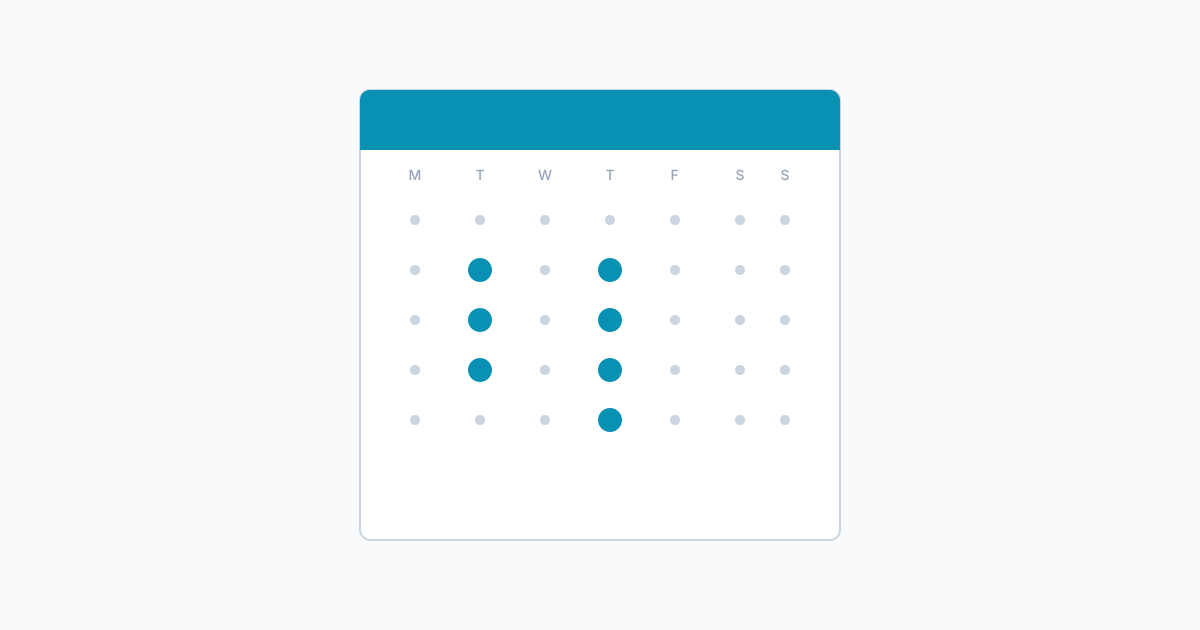
It is Wednesday morning and you cannot focus. You blame the coffee, the meeting at nine, the weather, the noisy upstairs neighbour. But the answer was logged Tuesday night, in two fields you have been tracking for a month: bedtime and screen time. A same-day view will never catch that, because the cause and the effect are not on the same row.
That gap, between yesterday’s behaviour and today’s experience, is where a lot of the interesting patterns in personal data actually live. This article explains what a day-after effect is, why most trackers cannot see one, what kinds you are most likely to find in your own data, and how to look without overreading it. If you are newer to all this, start with our guide to personal analytics and come back when you have a few weeks of logging behind you.
Same-day vs day-after patterns
Two fields, measured every day, can relate to each other in two distinct ways.
A same-day pattern means both values come from the same date. You drank four coffees on Tuesday, your mood rating on Tuesday was a 6. Both readings sit on the Tuesday row. When you compare those columns across many Tuesdays, Wednesdays, Thursdays, you are asking: when one number is high on a given day, is the other usually high too?
A day-after pattern, sometimes called a lagged correlation, compares one field on day N with the other on day N+1. Last night’s sleep on Tuesday is matched with this morning’s focus on Wednesday. Same person, same two fields, completely different question: when one is high on a given day, is the other usually high on the next day?
The shape of the relationship can be very different between the two. Some pairs only show up at the same-day level. Some only show up at the one-day-later level. A few show up at both, and tell a more complete story when you see both views.
Why most tracking apps miss it
Most habit and mood apps were built to count one thing at a time, on the day it happens.
A streak tracker measures one habit and rewards consistency. A sleep app shows you how you slept last night. A mood journal stores your rating with the date. Each of these is fine for what it does, but each is locked to a single day at a time. When they do show comparisons, they almost always compare values from the same day, because that is the simpler thing to compute and display.
That works for short stories like “I drink less water on days I forget my bottle.” It quietly fails for slower stories like “I am calmer on days that follow a long walk,” or “my Tuesday is a function of how my Monday ended.” Those connections involve a delay, and a same-day-only view cannot show them. The pattern is there in the data, but the app has no way to look between rows.
This is also why journal-style apps and screen-time dashboards, helpful as they are, rarely surface this kind of thing on their own. They were not designed to.
What a day-after effect looks like in practice
Most people who start logging carefully find at least one day-after pattern within a month or two. The flavours below are common starting points. None of them are guaranteed for you. The point of personal analytics is that the answer is yours, not borrowed.
Sleep quality leads next-day focus
This is the classic. You rate your sleep each morning on a 1 to 10 scale. You rate your focus at the end of the day on the same scale. Compared same-day, the numbers are noisy. Compared with a one-day shift, so last night’s sleep is lined up with this morning’s focus, a relationship often gets cleaner. The story your data is telling is not “I slept well today and felt focused today.” It is “I slept well last night and felt focused this morning.”
This is not advice to sleep more. It is a description of what your own data does. Some people see this pattern strongly, others barely at all. Both are valid answers.
Late-night screen time leads next-day mood
A common pair: how late you stopped using a screen, and how you rated your mood the following day. Same-day, the connection is muddy, because your evening screen time is not over yet when you log it, and your evening mood is being shaped by many other things. Across a day shift, the picture tightens. Often what shows up is not a strong link, but a directional one: long late-night sessions tend to sit next to lower next-day mood ratings.
Again, this is descriptive. Some weeks the pattern shows; some weeks it does not. That variation is part of what makes the result trustworthy when it persists.
Evening alcohol leads to next-day sleep quality
This one is interesting because it is a chained effect. The thing being measured the next day is sleep, which is itself a driver of focus. So you might end up reading the chain as: drinks on Tuesday, worse sleep Wednesday morning, lower focus Wednesday. None of those links are guarantees, and your data may or may not contain them. But when they do appear, they form a small narrative that one number alone could never tell you.
Weekend social plans lead to Monday energy
A softer one, with less obvious causality and more individual variation. Some people log noticeably lower energy on Mondays after weekends with a lot of social plans; others log the opposite, with a clear lift from time spent with people. The interesting bit is not which direction you fall in. It is that you can see the direction at all, with two months of honest logs.
How Loggr surfaces day-after effects
Loggr’s pattern detection is built around this exact gap.
For every pair of fields you log, Loggr computes the relationship on the same day and with a one-day shift, then keeps whichever one is stronger and most reliable for your data. You do not have to choose a setting, configure a lag, or know which is which. You see one short, plain-language sentence that says what the relationship is, paired with a small chart so you can see the difference at a glance.
A few important things about how this works:
- It is not AI advice. It is automatic pattern detection on your own logs. Loggr describes what the numbers do, not what you should do about it.
- It only surfaces patterns that are reasonably strong. Loggr does not show you noisy comparisons dressed up as findings. A weak relationship is labelled weak; a moderate or strong one is shown more prominently.
- It needs a baseline of data. A few days is not enough. A couple of weeks is the minimum to start seeing anything; a month is when day-after patterns become genuinely readable. If there is not enough data yet, Loggr says so clearly instead of inventing something.
- It works across all six field types. Number, scale, yes or no, categorical, text, and the dedicated blood pressure field can all participate in the comparisons in different ways.
The framing matters. Loggr shows you the connection. You decide whether it is meaningful for your life. That handoff is intentional.
What day-after correlations do not prove
This is the part that often goes missing in tracker marketing, so it is worth being direct.
- They do not prove causation. “Long late nights and low next-day mood are linked in my data” is not the same as “long late nights cause low mood.” Both could be downstream of a third factor like deadline weeks. Personal analytics is a starting point for thinking, not a finish line.
- They do not generalise. A pattern in your own data is about you, in your context, during this period of your life. It does not have to hold for anyone else. It also does not have to keep holding for you forever.
- They are not predictions. A pattern that has held for two months is a description of what has happened, not a forecast. People change, seasons change, jobs change, and the pattern can change with them.
- They are not medical advice. No tracker can or should tell you what to do about your sleep, mood, blood pressure, or anything else. Loggr describes; you decide whether to talk to a professional if a pattern concerns you.
Holding both ideas at the same time, that the pattern is real for you, right now and that it is not a universal claim, is most of the skill of using personal analytics well.
Pairs worth tracking if you want to find day-after effects
Day-after effects are most likely to show up when you log a plausible cause on one day and a plausible effect on the next. Strong pairs share two qualities: both are easy to measure honestly, and both can plausibly delay across a night.
A few combinations people commonly find useful:
- Sleep quality (scale 1 to 10) and next-day focus (scale 1 to 10).
- Late-night screen time (number, minutes after a chosen cutoff) and next-day mood (scale 1 to 10).
- Evening alcohol (yes or no, or number of drinks) and next-day sleep quality (scale 1 to 10).
- Workout done (yes or no) and next-day energy (scale 1 to 10).
- Time outside (number of minutes) and next-day mood (scale 1 to 10).
- Caffeine after a chosen time (yes or no) and next-day sleep duration (number of hours).
Three to five of these is plenty. If you are setting this up from scratch, our beginner’s guide to personal analytics walks through the starter setup in more detail. The principle is the same: small set of fields, logged honestly, for long enough.
A note on what counts as “enough data”
Day-after patterns are statistically harder than same-day patterns, because every gap day, every missed log, costs you the pair. If you log on Tuesday but skip Wednesday, that Tuesday-to-Wednesday comparison is gone. So coverage matters more here than for single-field stats.
Practically, this means:
- A week of data is interesting for getting used to the fields, not for drawing conclusions.
- Two to four weeks of consistent logging is where week-level insights start being meaningful.
- A month or more is where day-after patterns become reliable enough to take seriously.
- Strong patterns are rarer than weak ones. Most of what your data shows you will be subtle, and that is fine. Subtle and real is more useful than loud and made up.
Loggr handles the “is there enough data” question for you. It will not surface a day-after insight unless there are enough paired days to support it. When there are not, it shows the pattern as locked, with a brief note on what is needed.
FAQ
Why one-day lag and not two or three?
Most of what shapes a person’s day is set up the day before, not three days before. A one-day lag is enough to catch the big effects (last night’s sleep, last evening’s screen time, yesterday’s workout) without burning through your data. Longer lags would need much more data to be reliable, and the signal is usually weaker anyway. One day is a practical sweet spot.
Can I see same-day correlations too?
Yes. Loggr compares same-day and one-day-shifted for every pair of fields you log, and keeps whichever relationship is stronger. So when same-day is the clearer story, that is what you see. When the day-after version is cleaner, that is what you see. You do not have to choose.
Do I need to log at a specific time of day?
Roughly the same time each day helps, especially for things like mood and energy, which drift over the day. The simplest rule is “morning log for last night, evening log for today.” If your habit is wobbly at first, do not worry about it. After two weeks, you will know which fields belong in which slot.
What if my pattern flips after a season changes?
That is normal. Personal patterns are not laws of physics. A relationship that was clear in winter might be weaker in summer; a pattern from a deadline-heavy month might not hold during a calm one. Loggr re-checks each period, so if the world changes, the insights change with it.
Can I track something on a weekly basis instead of daily?
Day-after correlations need daily data, by definition. Loggr’s weekly, monthly, and yearly views aggregate the daily logs, but the comparisons themselves still rely on per-day pairs. If you only log once a week, you will still see weekly stats, but you will not see day-after patterns.
Key takeaways
- A same-day pattern compares two fields on the same date. A day-after, or lagged, pattern compares one field on day N with another on day N+1.
- Most tracking apps only look at the same day, which is why day-after effects, even strong ones, often go unseen.
- Common day-after pairs include sleep and next-day focus, late-night screen time and next-day mood, evening alcohol and next-day sleep, weekend plans and Monday energy.
- Loggr compares same-day and one-day-shifted versions automatically for every pair of fields, and shows you whichever is stronger, in plain language with a small chart.
- A correlation, day-after or not, is not a cause. It is also not a prediction, and it does not generalise to anyone else.
- Day-after patterns need consistent daily logging. Most people start seeing them around the one-month mark.
See your own day-after patterns
If you have been logging for a couple of weeks, open Loggr and look at the weekly view. The day-after patterns usually start showing up there first, before the monthly and yearly views fill in. If you have not started yet, three fields and two weeks of honest logging is the smallest experiment that can pay off. You can open Loggr and set up your first field in under a minute. Six field types, iOS, Android, and web, same data everywhere. No advice, no streaks, no chatbot. Just your own data, calmly compared with itself, including the part that happened yesterday.